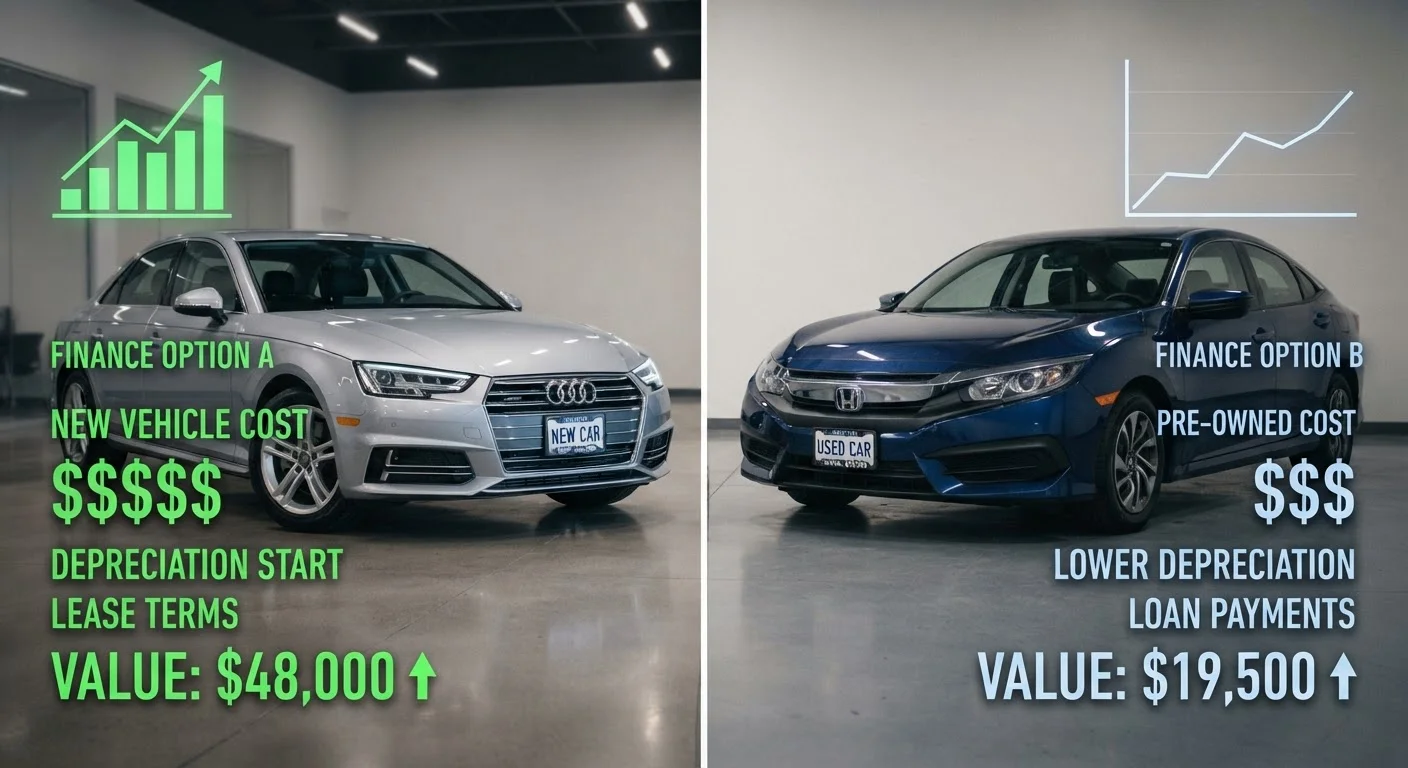
Why Sticker Price Alone Misleads You
The advertised purchase price of a vehicle captures only one moment in a multi-year financial relationship. Once you drive off the lot, five cost categories begin accumulating simultaneously: depreciation, financing charges, insurance premiums, fuel, and maintenance and repairs. Ignoring any one of them produces a distorted picture of what you're actually paying to own a vehicle.
A useful benchmark is cost per mile or cost per year calculated across your expected ownership period. A new vehicle priced $12,000 higher than a comparable used model isn't necessarily more expensive over five years if its maintenance costs are lower and its financing rate is significantly better. Conversely, a used car with a rock-bottom purchase price can become costly if it requires frequent repairs or commands a high-rate loan. See our guide to financing and loan terms for how loan structure affects total outlay.
Depreciation: The Cost That Hits Hardest
Depreciation is the largest single expense for most vehicle owners — and it hits new cars disproportionately hard. Industry data consistently shows that new vehicles lose roughly 15–25% of their value within the first year and approximately 40–60% over five years, though the exact rate varies by segment, brand, and market conditions.
~20%
Average new car value lost in year one
Industry estimates from automotive valuation sources consistently place first-year depreciation for most new vehicles in the 15–25% range.
40–60%
Value lost by year five on a new vehicle
Five-year depreciation varies widely by segment and brand, but this range represents the broad industry pattern for mainstream vehicles.
Used vehicles, particularly those three to six years old, have already absorbed the steepest depreciation curve. Their remaining value loss is flatter, which means the owner retains a higher percentage of what they paid when they eventually sell or trade. This dynamic is sometimes called the depreciation sweet spot — the vehicle is still mechanically sound but the original buyer has absorbed the sharpest value drop.
If you buy new and sell after two years, you're almost certainly taking a significant financial loss relative to the miles driven. If you buy new and hold for ten-plus years, the depreciation cost per year shrinks considerably and the calculus changes. Our breakdown of the used car value case examines this curve in more detail.
Financing, Insurance, and Ongoing Costs Compared
Beyond depreciation, three recurring cost categories create meaningful differences between new and used ownership:
- Financing: New car loans generally carry lower interest rates than used car loans — sometimes by 2–4 percentage points — because lenders view new vehicles as lower-risk collateral. However, new car loan balances are larger, so even a lower rate can mean higher total interest paid. How financing terms differ between new and used loans walks through what to expect on each side.
- Insurance: New vehicles typically cost more to insure due to higher replacement value and lender-required comprehensive and collision coverage. However, older used vehicles may also carry elevated premiums if they lack modern safety systems. The gap isn't always as large as buyers expect. See what actually drives the insurance cost gap for a fuller picture.
- Maintenance and repairs: New cars benefit from manufacturer warranties — typically 3 years/36,000 miles bumper-to-bumper and 5 years/60,000 miles powertrain — that absorb most repair costs early in ownership. Used vehicles outside warranty age require the owner to self-insure against repairs, which can be unpredictable.
| Cost Category | New Car | Used Car (3–6 yrs old) | |
|---|---|---|---|
| Depreciation rate | 15–25% in year one | Slower, curve already flattened | |
| Financing rate (typical) | Lower (lender-preferred collateral) | Higher by 2–4 percentage points | |
| Insurance cost | Higher (replacement value + lender requirements) | Moderate to lower | |
| Warranty coverage | Full manufacturer warranty included | Likely expired or limited | |
| Repair unpredictability | Low (warranty absorbs most costs) | Moderate to high | |
| Purchase price | Higher upfront cost | Lower upfront cost | |
| Long-term value retention | Better if held 7+ years | Good in depreciation sweet spot |
Fuel costs generally track vehicle type and efficiency rating rather than age, though newer model years sometimes offer meaningfully improved fuel economy in certain segments.
Running the Numbers: A Framework for Your Decision
To make a genuinely apples-to-apples comparison, calculate total estimated cost of ownership over your planned holding period using this structure:
- Purchase price minus expected resale value = net depreciation cost
- Total interest paid on your loan over the term
- Annual insurance premiums × number of years
- Estimated maintenance and repair costs — use manufacturer scheduled maintenance guides for new cars; for used cars, factor in age, mileage, and inspection findings
- Fuel costs based on your annual mileage and the vehicle's EPA rating
Add these five figures together and divide by the number of years you plan to own. That annual figure — not the sticker price — is what you're actually paying. For buyers weighing a CPO vehicle as a middle-ground option, how new and CPO pricing compares provides useful context. For a comprehensive decision framework that incorporates these and other practical factors, our complete new vs. used decision guide is the logical next step.
This article provides general financial education about vehicle ownership costs and is not personalized financial or purchasing advice. Consult a qualified financial professional before making decisions based on your individual circumstances.